|
Weekly Updates & Forecasts - January 2008
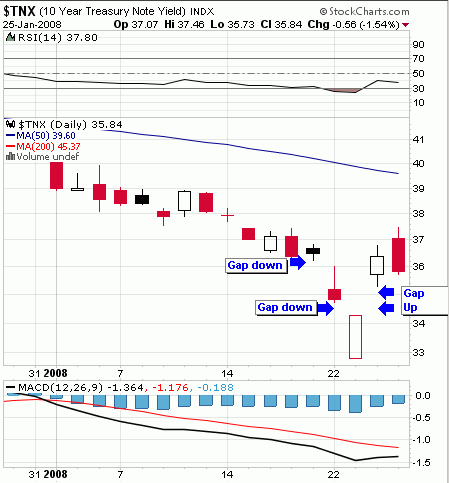
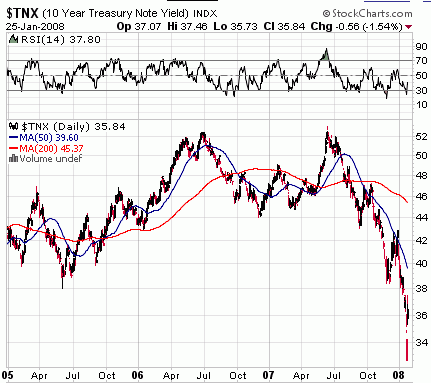
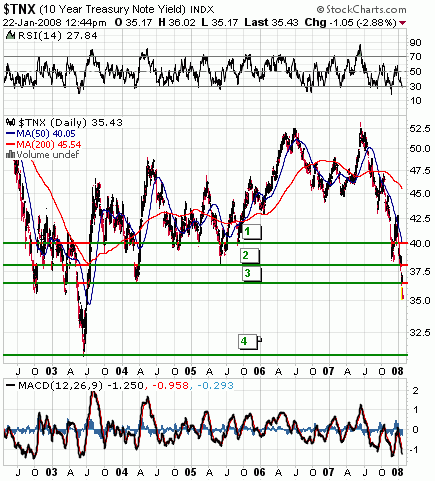
January 27 Update:Gold:The heading of this section might as well be “Extreme Uncertainty”. The fact that gold has recovered and exceeded its very recent high at $905 in such a short time is significant in and of itself. The reason, of course, was Bernanke’s fear-reaction to the SocGen trader debacle, which shows only to clearly that “the powers” have lost control and are progressively losing more control with every day. The French investment bank Societe Generale has suffered multi-billion dollar losses and its stock was crashing, so Bernie thought that is proof the sky was falling and he enacted an early-morning, out of turn emergency rate cut of 75 basis points. In fact, it was only a rogue trader at SocGen who had been trading billions of dollars worth of securities without authorization. If you ask me, that story line looks as contrived as the nonsense about Saddam trying to buy yellow-cake uranium back before the Iraq invasion began. I have no evidence, but that story coud well have been planted to calm the market’s fears. It just makes no sense that a single rogue trader makes such enormous deals for such an extended period of time with no apparent financial benefit from it. They claim he is “a little bit insane” and so what he did didn’t really have to make sense. I wouldn’t be surprised if it turned out that he is a patsy and they didn’t have enough time to engineer a paper trail of supposed profits. But again, I have no evidence thus far. It’s just a hunch. There is no point in showing gold’s chart here, as there is nothing significant going on with it from a technical viewpoint. Although gold closed slightly lower on the NY trading day compared to its start, it maintained its price quite well. Gold StocksEven the gold stock indexes maintained their levels well despite closing down for the day. That is significant as well, although it’s too early to call it a major event. The trading next week will have to show whether they are losing their volatility to the downside. If so, it could be an indication that regular investors are “discovering” their unique market position. We shall see. Interest Rates:If you want a picture-perfect representation of what market dislocations look like on a chart, all you need to do is take a look at the TNX, the 10-year US treasury note yield.
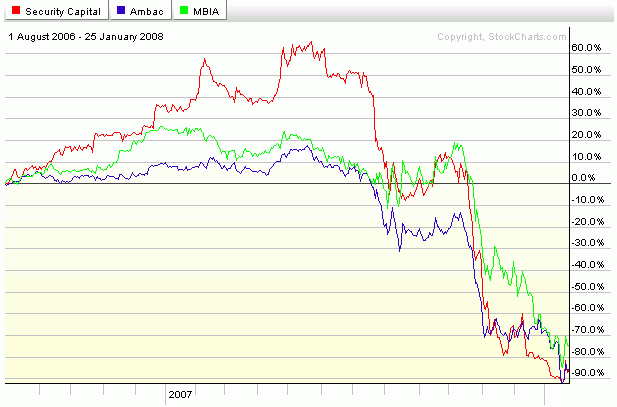
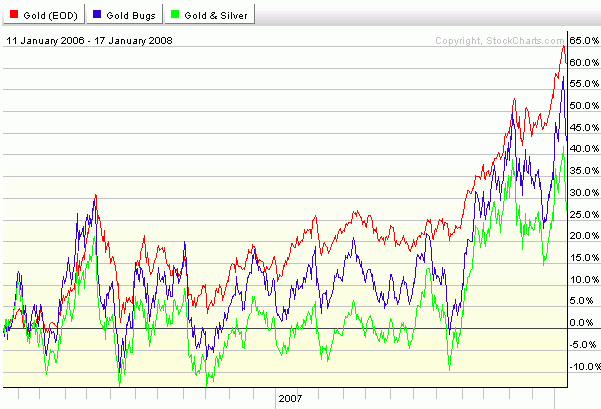
These bond insurers’ it turned out, no longer have the money to cover all the liabilities they insured over the years. The total amounts of munies and corporate bonds insured this way number in the trillions of dollars worth. The reason they are short of cash is that more and more bond issuers (local governments and corporations) are actually defaulting on their interest payments (sometimes even principal payments), draining the cash reserves of the insurers. More of that is coming down the pike. All that is, of course, happening courtesy of the subprime lending mess. Many of the bonds issued were collateralized by bad mortgages, and those just went “poof” this past summer. The insurers then had credit lines with banks, but the banks are licking their own wounds from the bloodfest and don;t want to lend. They also shy away from bailing out any bond investors so that the bond industry has to be supported by new sratups with private equity funding. The ironic thing is that the fear of loss and risk-aversion engendered by this scenario has driven investors like lemmings into the government-backed debt markets, which is why rates are so low. All of this began in the summer when official inflation numbers were still benign, but now even those self-serving statistics are showing massive price increases in the consumer sectors, all while lending activity is grinding to a halt. It is very well possible that this past week saw the apex of the rise in bond prices, and the nadir in long term rates. And that means they will be crashing from here on out, quite possibly with lightning speed. The consequence of that, obviously, will be that long rates will be rising sharply. Parking your money in low-yielding government bonds over many years while inflation is rising just makes no sense. The Fed will have to be quite busy buying up all of that government debt to prevent a huge rate spike. Fear has already taken hold in investment markets across the globe. Huge 5+ percent declines in Asian stock markets were briefly stopped by the Fed’s panic move, but that won’t last. Gold will very likely go to new heights in this climate. This coming week, especially with rebounding oil and the Dow bouncing, gold should see sizable gains - but I’m not getting back into gold mutual funds until I see proof that mainstream investors have discovered gold stocks. See you next week. January 20 Update:Gold Stocks:Gold stocks and funds are becoming trickier and trickier to invest in, and that’s why timing becomes more and more important. By the same token, this makes them far less of a suitable investment vehicle. Gambling addicts will exult in the ample opportunities for trading the stocks, but anyone seriously concerned with his long term wealth picture should probably stay away from them until after gold has its annual spring-time correction during April-May. The following comparison chart tells the story perfectly:
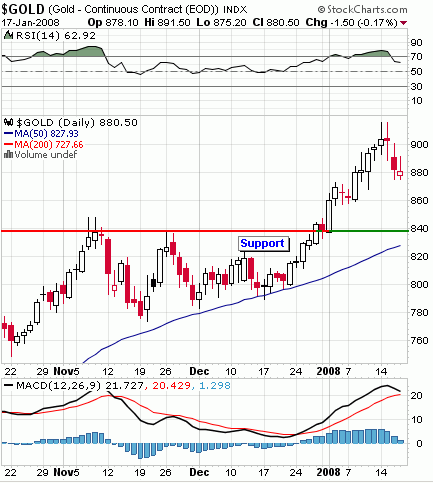
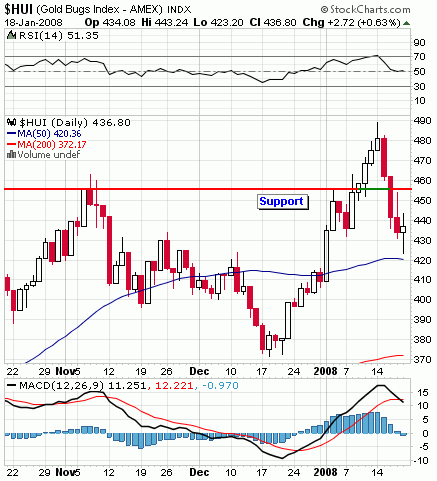
CHART As you can see comparing the red line for gold with the other two, while gold merely corrected and built a new base for its next up-leg during November-December, the stocks had serious breakdowns. It also confirms that stocks are no longer a lead indicator for gold. The fear factor for stock holders is now so big that they exclusively take their cues from gold, overreacting in both up and down moves - but especially in down moves. Gold:Gold has held up quite well, so far, despite the bad news coming from Indian gold merchants and jewelers this week. In case you missed my email and the follow-up article on the issue: Indian gold dealers and investors are selling gold for ordinary stocks because they think that the gold price is “too high”. They haven’t seen anything yet. In the meantime, however, the world’s major source of gold demand during the most critical time of year, the official Indian gold-buying season, has dropped off significantly from last year and will probably drop further if this trend continues. As Indian gold dealers, jewelers, and buyers divest themselves of gold and buy Indian stocks, stocks will climb even faster than before, luring more gold holders out of their metal holdings. At some point, this will begin to reverse, however. That’s when, for a relatively short time, buying gold stocks will become highly profitable again. I will let you know when that time comes. For the week, gold has corrected downward from its quick shot at $915 an ounce and is now trading in the $880 range. It has come back off the oversold range and remains well above its November high, while the stocks have fallen well below theirs.
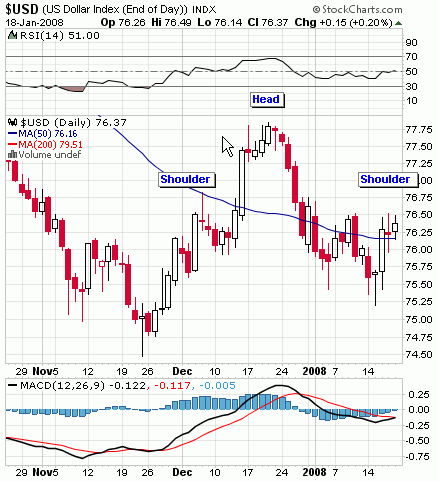
If you are on a monthly buying program, stick to it, but if you are waiting for a great opportunity to make a large buy - wait. There may still be a near-term upside to gold due to mounting near-catastrophic developments in economic news, but sooner or later gold will correct back down to near the $700 level. Major planned purchases should be deferred until then. The Dollar:This past Wednesday the dollar had a significant up-day as a result of ECB comments regarding slowing euro-zone growth, easing rate hike concerns voiced earlier by Trichet. At the same time the Fed’s “beige book” eased concerns about a sudden US slowdown already being in the works. Supposedly, the economy still grew compared to November figures, just s little bit slower. Naturally, there is still a very good chance for a significant drop off for the dollar off the right shoulder of its building H&S formation discussed in earlier updates and articles.
(01-22-08 Interim Update): Interest Rates: Bernanke just lowered the federal funds rate by 75 basis points, shocking the markets. The TNX is dropping below Line 3 Support and now has nothing to brake it before it hits Line 4, it's all time low since the 1970s. This may well bring the buck below 73 on the USD Index - and therefore into the outer abyss.
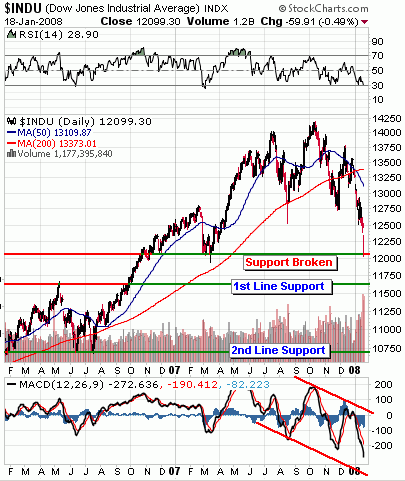
If that happens, there will be no stopping gold, regardless of India, and our entire thesis concerning gold stocks may have to be revised. The Dow:The Dow just said: ”Ouw!!” this week. It has broken below its previous line of support at 12,250 and is on its way down to the remaining 1st line at 11,750. The scary thing is that this carnage has not even taken the Dow’s RSI into oversold territory. That means the 1st Line Support could be broken next week.
Only two or three months ago, a number of noted commentators have talked about contrarian principles, etc. indicating that a bottom was forthcoming and then “back up into the stratosphere” - Not! This stock market has yet to reach its bottom. In my opinion, it has yet tocome even near its bottom. We shall see. Until next week ... January 13 Update:Gold Confirms Breakout:Gold broke above its all time high during the first week of 2008 and confirmed its breakout this past week, touching the $900 level. It also broke out of its second gear track at just about the same time. 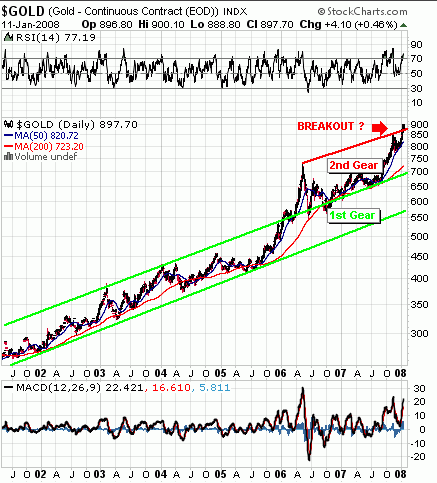 It is now in overbought territory and could snap back below the red uptrend boundary at any time, but the news for the general economy, including non-gold stocks are pretty bleak. The Dow has seen its worst new-year start since 1982. Some say since 1929. Either way, if we're not back to 1929 yet, we'll get there soon. The Gold-Dow DivorceThe past three months have been the longest time I have seen gold and the Dow part ways since they "married" back in 2003. I am not just talking about a general parting of their ways, but a parting during which gold maintains the upper hand for an extended time. 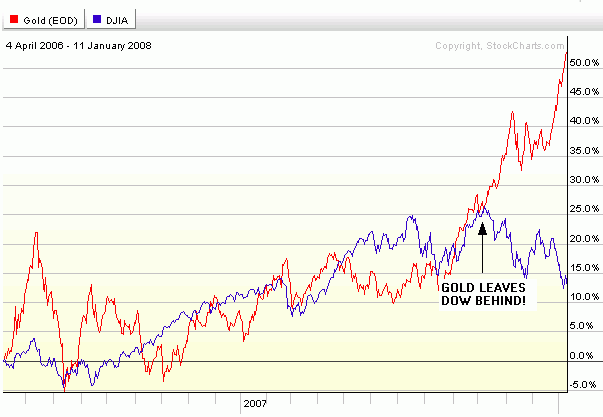 I have been expecting this since 2004. So far, the world's debt masters have always had sufficient ammunition to bring gold back into compliance. This time, they have other things to worry about - like survival, for example. That can be quite distracting. Gold StocksGold stocks have filed for divorce as well. After an initial period of legal separation, they've finally had enough. The Dow and other stocks are too much of a ball and chain around their ankles. 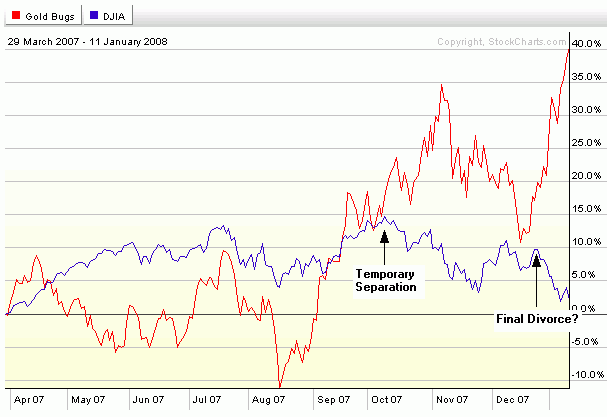 It is early yet in this process, but stock investors should take solace in the fact that the early indications do not show gold stocks to be following their more mundane cousins down the drain. For as long as gold continues upwards and out-paces the advance in gold production costs, its stocks will remain profitable. Until the ore grades get so low that production costs begin to catch up again. Oil:Gold has also finally torn itself loose from its sometime slavish devotion to oil. Particularly the last two weeks have shown that the direction of oil prices does NOT determine the direction of gold prices. Oil's megaphone pattern is beginning to bite. 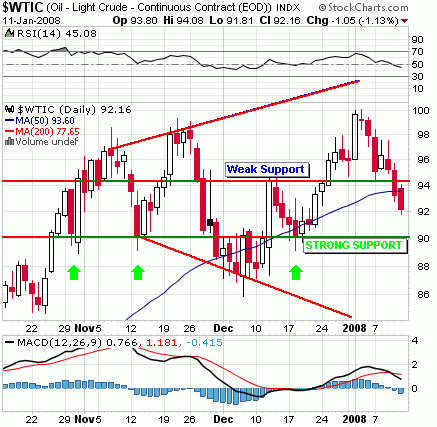 It has broken down below the weak support line and is only two bucks away from major support at 90. If it goes below 88, it may fall all the way to the $80 range again. Sounds unlikely, but it's very possible. At least there will be one benefit to living in an extended economic downturn (the other one would be making a bunch on your gold and stock holdings). The DollarThe buck has no luck. Bernie said he will drop rates again, maybe for a half-point cut, and Trichet from across the Atlantic indicated his predilection for hawkishness. The ECB just wasn't build to bail industry and the markets out at all cost. Commentators think there is increasing pressure on him to cut as well - but he won't. Not this time around, and probably not the next time, either. The good old buck is completing its right shoulder as we speak. The most ominous fact is that even the RSI is developing a marked head and shoulders pattern. That can't be good. Despite all of the above gold bullishness, it pays to be cautious, especially with stocks and if you just must trade in paper gold, no matter what. Gold could easily correct downward from here before making its final assault on the $900 level. Oh, by the way: China is going to have more success than it really wants in reining in its boom. Many fear that the US contraction could dump China into a severe tailspin as well, leaving the world without an economic engine. As China's US exports slow, it will have even less of an occasion to buy treasuries. Wonder how much more treasury-buying the US Fed can stomach. I expect that some time during the next three months long term rates will bottom out and start shooting up, saddling the already weighed down US economy with inevitably higher long term interest rates. See you next week. January 6 Update:Gold:Gold had a fantastic breakout during the first partial trading week of the year. It more than confirmed the mini-breakout of the last trading day in 2007, and powered through the 28 year-old nominal record of $850. It is encountering some technical resistance at the current level of $860 - $865, as that level represents the (red) upper rising trend line of its "second gear" channel dating back to the 2006 high, as seen on the following long term chart: 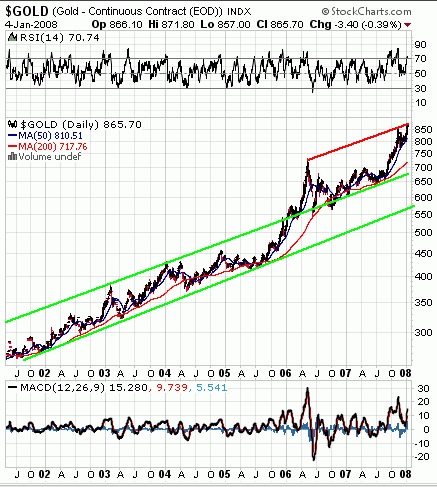 That resistance can prove quite a challenge, initially, as gold is currently entering overbought levels on the RSI. It is likely to fall back a bit in the early days of this coming week, and initial readings of the 24 hour chart show that to be the case. The big question is: Which one of the three successive new uptrend slopes in the following chart (blue lines) is the metal going to "pick"? 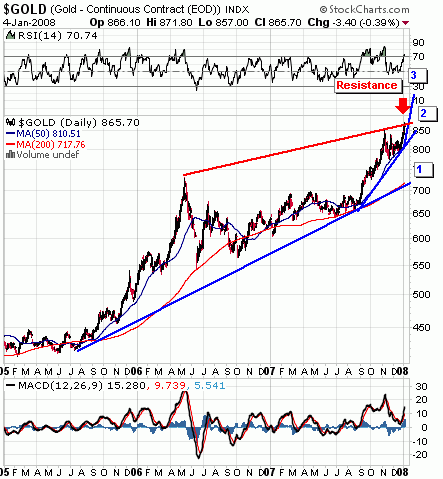 It would actually be a positive sign if gold fell back to about $830 or so and build a new base for its next thrust upwards from there. If it doesn't, any renewed rise will likely result in a deeper drop before it ultimately recovers. With Indian gold buyers being as slow as they are in realizing that gold will not be cheaper than $800 an ounce for extended periods for a long, long time to come, further strong rallies in gold are somewhat dependent on news of near-catastrophic developments like Benazir Bhutto's assassination in Pakistan, or further signs of a drastic economic slowdown. On the latter issue, I see no problems, though. There will be plenty to fret about for mainstream investors in the coming weeks. Gold Shares and Mutual Funds:The gold stock indexes all had a nice rally but neither the HUI nor the XAU has broken back above its previous high from November. For the XAU that level is near 195. For the HUI it lies at 455. Both indexes look like they still have positive momentum and neither is in overbought territory yet, although they are close. Another big up-day for gold will easily help them through it, though. 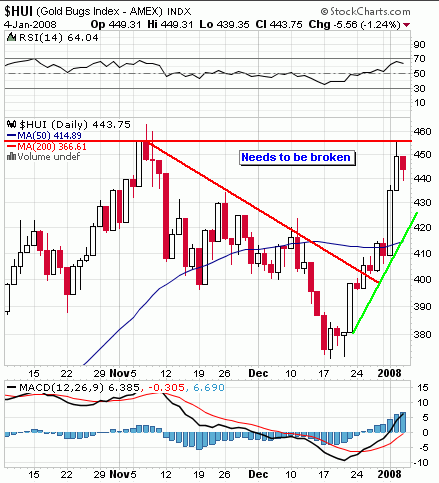 Silver:Silver just keeps on struggling. It seems to have lost its lust for life, somehow. For every day that gold and its shares had a major up-day, silver just struggled and struggled with tiny gains. The chart is in a similar position as the gold shares indexes - just below the November high. However, silver is just a tiny bit closer to its overbought territory on the RSI. 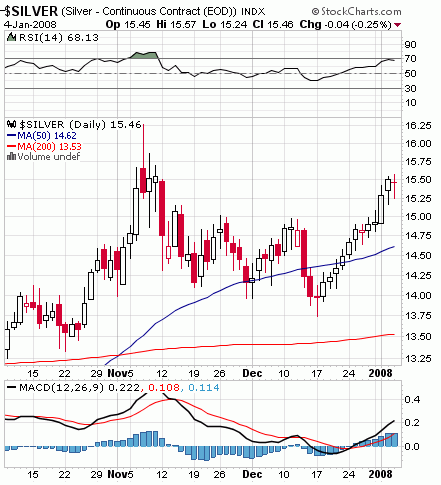
Thhe other that comes to mind is Warren Buffet. Nobody quite knows how much silver, if any, he has left from the stash he bought back in 1997. He is the only single private entity that can command such enormous amounts of metal. His "friendship" with donation to Bill Gates shows he is a one-worlder like many of the top folks on the economic and power ladder. It wouldn't be beyond him to use his silver stash to control its price so as to keep the silver-using industries from collapsing - but that i sall pure speculation. It doesn't satisfy me as an explanation of what's going on, and I haven't really read anything that makes sense based on sound fundamentals and reasoning. Silver commentaries are all over the place. The bullish ones are to be taken with a grain of salt - or two. Silver investors are by nature even more guilty than gold bugs of waiting for "the big one". I think that's a fundamental psychological weakness. Quite possibly, many of them are totally dispirited by how long it has already taken for a huge blow-off top to develop. Maybe that's an indication that the price will soon shoot up. I'd hate to bet on it, though. Ten Year T-Note Yield:There is a huge bubble forming in US treasuries. Their prices are unjustifiably high, and yields have accordingly suffered. The thing about bonds is that there are absolute upside limits that can never be exceeded. We are approaching them. Why would anyone hold (or worse, buy) a debt instrument inexorably tied to the failing dollar that is expensive to begin with, has low yield, and huge exposure to price-inflation, which itself is rising on all fronts? The tired old Keynesian view that inflation will falter with slowing demand in a coming economic downturn, and therefore pose less of a risk, is so much hogwash that it doesn't even merit discussion. The overhang of dollars, both within as well as without the US economy, is at historic record levels which means prices will keep risin, no matter whether a recession hits or not. We have seen record price inflation in November combined with record alleged treasuries buying. That makes no sense. If stock investors are concerned about losing their pants in equities, why would they buy into treasuries that will cause them to lose their shirts as well? Meanwhile, however, the TNX is still on its way down and may soon break through all four resistance levels within the next few months: 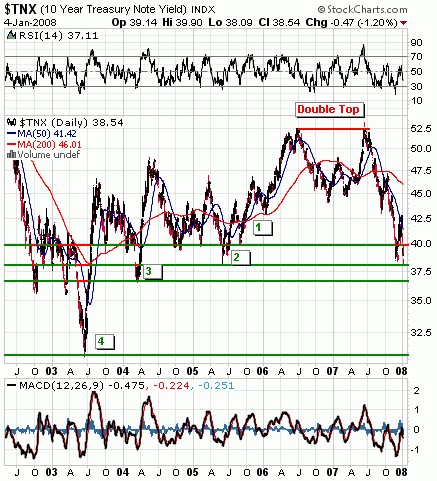 When the TNX hits bottom, though, watch out! The upward pressure for long term interest rates are accordingly very high. As bonds/notes sell off, yields/rates will shoot up, killing long term lending. If the Fed tries to buy up all that surplus in order to control rates, we will truly see hyperinflation here in the US. Oil:Oil doesn't really look like it wants to go through the $100 level and stay there. It has been flirting with that number for a while and sank back each time. There just doesn't seem to be that huge pressure underneath. The news says there is, but I just don;t see it. In fact, it almost looks like a slightly skewed double-top forming between the November and recent January high. That would confirm the megapone pattern we showed earlier in December. 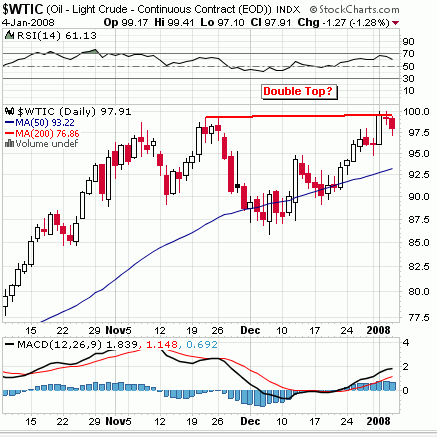 If oil drops off from here, the decline could be an extended one. That would naturally impact gold and help it correct a bit before going further up. All in all, barring external shocks from the geo-political side, the prospects for gold this week are rather flabby. See you next week. |


