June 2008 Issue (#47)IN THIS ISSUE:SECTION ONE: The Currency Outlook: a. Forecasting the Euro: The Fundamentals
b. Forecasting the Euro: The Charts/Technical Analysis
Who Is Affected? a. Businesses
b. Individuals
c. Governments (Political and Financial) Euro vs. Dollar FX Forecast for Q3 of 2008: Euro vs. Dollar FX Forecast for June 2008: SECTION TWO: Precious Metals Outlook Today's Gold Action (June 2, 2008) A Good Look at Platinum Platinum ETFs and ETNs: Gold Stocks The Dow/US Stocks The Political Outlook ==================================================== SECTION ONE: The Currency Outlook: In spite of the fact that dollar-based trade still comprises the majority of world trade, the euro has already become the most looked-to currency of the world. The more time passes, the larger the number of countries whose governments/central banks are loosening their traditional ties to the dollar. By necessity, that process involves increasing ties to the euro as the major worldwide trade-currency alternative. US companies contracting for business in euros must be intensely aware of this process and must follow its dynamics closely if they want to stay competitive in their respective markets and industries. The Euro vs. Dollar & Gold Monitor serves to bridge that knowledge gap by consistently taking the euro vs. dollar dynamic into account in analyzing financial and other markets. a. Forecasting the Euro: The Fundamentals Forecasting the euro is not so much a matter of looking at what drives euro, but rather consists of determining what if anything is holding up the dollar. The euro’s fundamentals can be summed up as follows: - A tremendous internal market exceeding that of the US
- US is largest external trade partner (comprises 40% of world trade)
- Growing foreign demand for euro balances
- Growing demand for international trade settlement
- Strong (nearly 100%) reliance on foreign oil.
- Central bank mandate focus on price-stability (controlling inflation)
- External trade surpluses or small deficits.
The dollar’s fundamentals are nearly the opposite: - A huge internal market, but smaller than the EU.
- EU is largest external trading partner;
- Decreasing foreign demand for dollar-balances.
- Decreasing demand for international trade settlements.
- Central bank dual mandate: price stability AND full employment.
- Huge and growing external trade deficits.
There is an additional dynamic at work between these currencies, and that is the relationship each has to gold. The US dollar system is structurally gold-adverse, meaning that the value of the dollar as a currency is in direct competition with the value of gold. US law still carries an obsolete “official” gold price that is completely divorced from economic reality, but which affects how the US values its gold reserves. Currently, that official, legislatively locked-in price lies at roughly $42/oz. The euro system is structurally gold “friendly.” EU law mandates that the ECB’s gold reserves as well as those of the member banks be revalued according to gold’s market price quarterly. The upshot of this is that the euro’s forex reserve position is strengthened when the market price of gold rises. This offsets some of the lack of confidence in fiat currencies normally associated with a high gold price, while the dollar’s reserve position remains the same, giving the euro a net advantage, however small the effect of that advantage may be. Although gold was officially “demonetized” in 1976, it is still retained as an important reserve asset by all major central banks. The reason for this is that it has never lost its function as an asset of last resort. Today, all other currencies or forms of money are essentially forms of credit, issued by central banks at will, sometimes at the behest of their respective national governments, sometimes not. Wherever there is a credit, there is a debt, and debt must either be paid or be defaulted upon. Therefore, all other national or international (i.e., regional) currencies constitute a liability of the issuing government or central bank, while gold remains the only non-liability asset. The Euro vs. Dollar & Gold Monitor’s analysis of, and forecasts for, the euro’s foreign exchange position are therefore always cognizant of the influences exerted by the US dollar’s fate and the role of gold in the world currency scheme. This is in contrast to most other euro analysts who focus exclusively on relative economic performance, balance of payments, and interest rate policy as the operative determinants of relative value. b. Forecasting the Euro: The Charts (Technical Analysis)The Monitor’s technical analysis (TA) never gets very fancy. Our philosophy is based on the following principle: “Fundamentals always break chart patterns, but chart patterns never break fundamentals.” With that in mind, we use charts as illustrations of past trends and to underscore fundamental analysis, but we rarely rely on them for actual forecasts. Fundamental analysis is and will always be the mainstay of the Monitor’s forecasts. Who Is Affected?a. Businesses: The entities that are primarily affected by the euro vs. dollar exchange rate are American and European businesses that contract with each other based on their foreign counterpart’s currency, i.e., US companies contracting in euros and vice versa. It is crucial for these companies to not only have access to reliable forecasts for the short, medium, and long term forex rate of their counterparties’ currency, but also to develop an understanding of the dynamics that influence these rates. b. Individuals: At the same time, all businesses are led by individuals, and all individual business leaders have investment portfolios to worry about. The impact of the euro vs. dollar dynamic on the different asset classes is therefore important to individuals and companies alike. On the investment side of euro vs. dollar analysis, gold (and precious metals in general) play a central role. As already stated, gold is what we call a “non-liability asset” or a “non-debt currency”. In other words, gold is the ultimate form of payment or, stated even more succinctly: “You earn/buy it, you got it, even if the world breaks down, you still got it” while other forms of money or assets follow the maxim ”You earn/buy it, you got it - but if the issuer defaults, you got nothing.” c. Governments: Political and Financial Governments are of course supremely affected by what happens to their currency in an (more or less) open market. That’s why they naturally tend to exert their political (and sometimes military) muscle in the direction of maximizing control over their currency’s value. However, since the dawn of the age of credit-money, governments are no longer fully independent or sovereign entities. We therefore distinguish between political and financial (or monetary) governments. In the inevitable tug-of-war for power between political and financial governments, the monetary authorities wield the bigger clubs and usually end up being the winners. It is not hard to see why this is so. Most nations’ central banks are legislatively granted a large degree of autonomy, also referred to as “political independence”. In other words, a country’s political authorities have no business telling their central bankers how to do their business. Central bankers regularly “report” to the political authorities, but the politicians normally have little or no oversight powers over their central bank’s policies or activities. Central banks have the legislatively granted ability to fund the political governments’ deficit spending by issuing “credit” to the governments, thereby turning them into debtors. This “credit” is then counted as part of the country’s money supply, which inevitably raises the specter of inflation. “Inflation” is the growth of a country’s total money supply, also known as “monetary” inflation. Price-inflation, on the other hand, is the inevitable result of excessive monetary or credit expansion. It is therefore technically not coterminous with “inflation.” The Monitor always attempts to make this clear by referring to price-inflation when we are talking about rising prices and “inflation” when growth in monetary aggregates is addressed.In the end, therefore, it the policies of a country’s central bank are what determines the value of its currency to a very large degree. Central bank policy is aimed at influencing interest rates (i.e., the cost of borrowing). This is done by increasing or decreasing the supply of money circulating in the economy. Euro vs. Dollar FX Forecast for Q3 of 2008:The risks of exchange rate moves of the dollar over the next three months are decidedly to the downside. Any upward movements will be short lived and will only result in a sideways trend until some other shoe from the feet of this financial centipede drops. I see little if any forces that would support a prolonged upward push. There are only two factors that will lend support to the dollar. One is higher interest rates resulting from reduced attractiveness of US treasury debt, and the other is overt or covert currency intervention. GDP growth numbers are at best suspect since they always can and will be revised. It is just too easy to use their announcement as a policy tool. The name of the game is: “If the Dow is threatened, make the numbers a tad bigger to calm fears.” Once the storm passes, they can always be revised back downward, sometimes even in later quarters. Earlier this year and late last year, Persian Gulf states were debating their need to get off their respective dollar-pegs. Now, the issue is back on the front burner. A recent Merrill Lynch report hints that the GCC states could go off the peg “within months” while official announcements from the states involved deny this and US treasury Secretary Hank Paulson says that their decision to go off the peg or not is a “sovereign issue” – whatever that means. The fact remains that these oil-producing countries’ pegs to the dollar exist only because they trade their oil exclusively for dollars. That, in turn is one of the main reasons why there is worldwide demand for US dollars. If Gulf States, especially Saudi Arabia, stop demanding dollar for oil, world dollar-demand will suffer a serious setback, which can result in a massive worldwide run away from accepting dollars in settlement of international trade. This massive cloud continues to hang over the dollar, regardless of what the US Fed or the ECB do or say when it comes to setting interest rates. For that reason, even a massive spike in US interest rates as a result of what I call “flight from non-existent quality”(i.e., a massive US treasuries sell-off due to rising inflationary expectations) is unlikely to present sufficient support for the dollar to keep it from falling over the medium term. In addition, the much talked-about pricing in of a bias toward tightening rates by the Fed is unlikely to give the dollar enough support to mount a challenge to its 200-day moving average, which currently lies at 75.7 on the dollar index.The dollar is now right at 73. Barring such a challenge, there is no chance for the 50-day MA to cross back over the 200-day MA, which would be required for the dollar’s medium-term chances to markedly improve. All in all, I see the dollar moving sideways in a band marked by the 74 level on the upside and the 71 level on the downside until gold takes on its next leg up on its journey to $1,400/oz. toward the end of this year. Euro vs. Dollar FX Forecast for June 2008:The press hails the dollar’s stellar performance over the past two months. Reuters gushes that this is the first time the dollar has put in its first back-to-back monthly increases since 2007. Not exactly a recommendation, in most people’s eyes. Upon closer examination, this performance doesn’t look so great at all. Since the reversal on March 17th, the Monday after the Bear-Stearns bailout and fire sale to JP Morgan, the dollar has had only 14 clear days of upward movement while it put in 34 days of sideways to downward movements (accentuated by a red line over the top in the chart below). This is very similar to the Dow’s recent up-move, which was shown in one of May’s Weekly Monitor Updates. In other words, it has a decidedly contrived look. By “contrived” I do not mean outright clandestine buying by active market manipulators a la the gold cartel, even though I do suspect covert currency intervention by governments and central banks here and there. Rather, it looks like certain news reports that traders tend to act on were intentionally skewed to show a rosier picture for the dollar than reality would support. Otherwise there is no reason why such powerful up-moves should be capped by such (relatively) prolonged sideways periods. Technically, the dollar seems to be struggling with its short-term resistance marked by the peak of the post-Bear Stearns rebound. During the first two weeks of May it tested that resistance but wad found wanting, and this past Friday appears to have shied away from that level after merely touching it intra-day, then closing below it. Barring any devastating news, the outlook for June is a continued sideways movement in a similar fashion; any piercing of this rather weak resistance will probably be followed by a sinking-back period. If at any time the dollar index should fall below 71, however, and then continue on past 70, all bets are off. I have no idea where the next support level would be - or if one can even be found below that point. It is noteworthy that the above analysis contradicts what most other euro forecasting services show. The ones I have reviewed show the euro continuing to sink back, i.e., the dollar rising over the next three to six months. For example this one, which shall remain nameless: 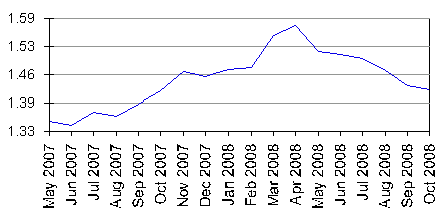
For the euro to fall back to the 1.44 level, the dollar would have to break through its 200-day MA and make it back to 77 on its index. Highly unlikely.SECTION TWO: The Precious Metals Outlook:Gold is currently still weak. Chart-wise, it hit and bounced off the $870 level on Friday at the beginning of the London session, but flattened out as soon as it hit New York. It is currently continuing the same way in Hong Kong. Fundamentally, gold is recovering from the loss of the Indian buying market, which alone should have socked it all the way back to the $700 level in a jiffy. The fact that we’re still above 28-year support at $850 under those circumstances is very positive overall, but in the short term does not provide much in the way of strength. I would actually like to see it hit the $850 level again, which would form a nice double-bottom from which to rally upward. We may yet see that happen – but not this week. Indians currently think that gold is “too expensive” and that their country’s stock market is a better deal. Well, at least they thought so back in and early January. This is what has happened to their beloved stock market since then: 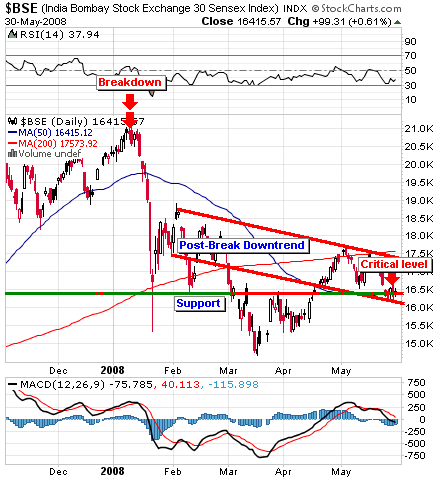
Funny thing, that this breakdown came only days after my article on the issue of Indian gold selling and stock buying. To be sure, gold has suffered, too, since mid-March, but when it goes back up in the fall I doubt the Indian stock market will do likewise.One thing seems pretty clear: that the end of the Indian wedding season will no longer exert the same gravitational pull it once did, for the simple reason that Indians are now on the main selling gold or at least staying away, waiting for lower prices. Indian gold demand for Q1 2008 as a whole is reported to have dropped 50 percent overall, so the end of a non-buying period will not depress prices this year quite as much as it used to. Today’s Gold Action (June 2, 2008): All of the foregoing was written overnight. This morning, gold and the dollar were up while oil and the Dow were “tanking” together (no pun intended) as the email alert stated. Since then, the dollar dropped back to zero for the day and gold kept on climbing while the Dow kept on falling while oil recovered and soared back up to $129/bbl. for West Texas Crude. (As I write this, the dollar fell completely out of bed, straight down, by a full 9 cents, within minutes. That doesn’t bode well for the greenback.) The fact that gold bottomed at $870 on Friday, closed higher, and extended its gains today in spite of a temporarily rising dollar and initially lower oil bodes well for the its near-term price action. All of this is happening in the face of “better than expected” ISM figures, mind you. Positive data of that type are normally cited as reasons for gold dropping by the press. This leads me to believe that gold will have a very positive run this week – unless the Dow’s woes tempt certain policymakers to put a stop to it, again. It is still vulnerable to that. In the end, I have no clear prediction for this week. A Good Look at Platinum: As indicated in last week’s Update, Platinum has had a huge run, doubling is already high price level from September 2007 until its recent peak at the beginning of March. The fact that Platinum peaked about two weeks before gold and silver topped and before US stocks and other paper assets bottomed is one indicator that it dances to a different drummer than the other precious metals. It is still mainly an industrial metal and its price movements are predominantly determined by industrial demand, but it has lured a steady stream of investment money seeking a refuge (or a profit dynamo), mainly from Asia, it seems. Since last weekend, the metal has dropped from above $2,200 back to $2000, but that level has held and it is now returning to its positive path, from just below its 50-day MA. 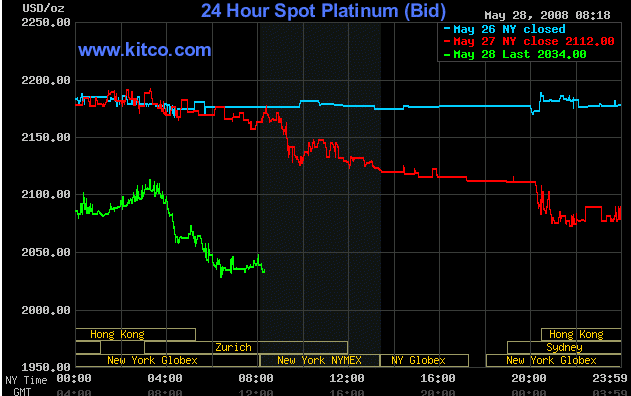
Platinum has suffered severe supply shortages last year as South African mine output encountered a whole slew of headwinds, from labor strikes to electricity shortages, while demand increased dramatically due to added automaker consumption in China and India, the fastest growing economies in the world where never-before seen income levels drive mammoth demand for new cars. This supply deficit is expected to continue in 2008 while SA mining problems continue as well. This should be a good year for Platinum. The biggest surprise in the Platinum group of precious metals, however, is not Platinum itself but Rhodium. That metal has made tremendous gains in 2007 and is literally off the charts in spite of recent plunges in all other precious metals. 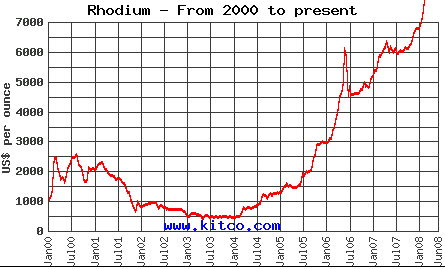
The current price lies above $9,000 per ounce – not even reflected on this Kitco chart here. You can get a very good and quick visual overview of the fundamentals of the Platinum Group Metals (or PGM) from this pdf file by Johnson Matthey.Rhodium production is severely concentrated in crisis-ridden South Africa, from where a full 60 percent of world Rhodium demand is satisfied. That means with current production challenges there expected to continue, demand outpaced supply by roughly 10 percent, which helped the metal triple in price in a mere 2.5 years. It took gold a full 6 years to accomplish that feat! Of course, I am not advising the storing of physical rhodium for economic emergency purposes. You wouldn’t be able to find a buyer in a severe crunch. In fact, it is even hard to find a non-industrial seller of the metal, and it has an additional drawback: there are no actual investment vehicles for Rhodium, like ETFs or coins, while Palladium coins are available from the Canadian mint, for example. Another drawback is that, in current pricing-crunches, many makers of catalytic converters are finding ways to switch to Palladium as a much, much cheaper substitute. Only diesel engines present a strong demand base, since their CATs require rhodium. There currently is no substitute for the metal in diesel converters. Platinum Exchange Traded Funds and Exchange Traded Notes: Platinum ETFs have only recently come online and have contributed markedly to the current price levels. Here are two of them, addressed in a recent Reuter’s article: - ETF Securities (PHPT.L), spiked 150 percent this year to a record high of 356,000 ounces this week.
- Zurich Cantonal Bank's ETF (ZPLA.S), up 20 percent to 53,000 ounces in the past three months.
The two platinum funds now hold about 85 percent of last year's global market deficit of 480,000 ounces. Not bad.But ETFs are nothing new. They buy and hold physical metal and let you buy shares in the fund like a stock investor. (The IRS, however, wants you to pay higher capital gains taxes for your gains in precious metals ETF shares, just like bullion holdings, if you hold them for longer than 1 year. Gains in mining company shares are taxed at the lower 15% rate. If you are in the 28% income tax bracket, none of this makes any difference to you.) What’s new are Platinum "ETNs", or Exchange Traded Notes. ETNs are debt securities, which means that if you buy one, you are loaning money to the issuer, which is usually a bank or investment brokerage. Instead of just promising you a stated rate of return plus return of principal, a Platinum ETN issuer promises to repay you according to how the price of Platinum moves in the meantime. These are basically corporate bonds issued by banks and indexed to Platinum as a benchmark. The first ETNs were created and sold by Barclays in 2006. Since then, there are now 56 different ETNs offered which are indexed to various benchmark assets. A twist in Platinum ETNs is that you can buy both “long” and “short” ETNs based on that metal, which allow you to bet on both up or down moves in the price. I do not recommend investing in these critters for the simple reason that there is nothing to back them up. If the issuing bank goes down, so goes the critter, and you are left holding the bag. ETFs at least have the metal when something goes wrong (at least in theory). Palladium: Of the three PGMs, Palladium has a small excess in supply and so is not squeezed as tightly as the other two are. What goes in Palladium’s longer term favor, though, is the fact that Platinum and Rhodium are getting too expensive and so (a) manufacturers of catalytic converters are going to find ways to substitute Platinum with Palladium, and (b) jewelry buyers will tend to buy more “white gold”, a gold-palladium alloy that looks just like platinum but is way cheaper. You can invest in palladium through the “ETFS Physical Palladium” ETF or through buying Canadian Maple Leaf palladium coins. They are not as liquid as gold and silver coins, though, because they are so rare. Palladium has experienced severe price swings. In 2001, the metal peaked at $1,100 an ounce and then dropped to the mid-$100s when Russia began selling off its Soviet-era stock. In January this year, the price fought its way back to jut below $600/oz., only to fall back to $450 again, where it is now. 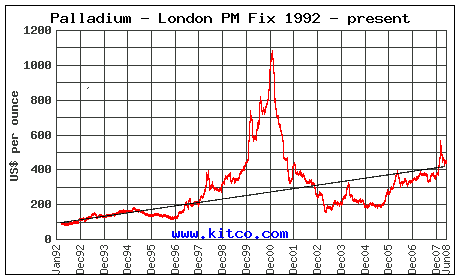
Since the price is now right at its long-term baseline after the March spike, this is probably a good level to buy in and wait for future supply shortages to occur from the above-cited factors. I see this more as a profit play rather than a long-term "hold", though, but that could change. A good strategy would probably be to whatever chunk of money you want to devote to this group and split it half ways, investing 50% in Platinum to take advantage of current supply deficits while “parking” the other half in Palladium to wait for future deficits to occur. When Platinum peaks dues to its exaggerated price and more and more producer money flows into Palladium, follow the producer money to take advantage of the resulting demand increase. Gold Stocks:Both the XAU and especially the HUI, are finally showing some potential for near-term improvement. The HUI is beginning to trace out a bullish pennant formation that can reverse the bearish megaphone pattern it has been so prone to forming of late. Given the currently rather positive outlook for gold, on balance at least, it could very well break out of that pennant pattern to the upside within the next two weeks. 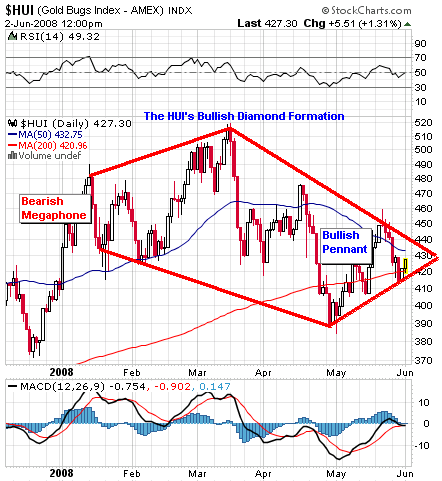
There’s nothing wrong with a little bit of good news on the gold stock side, for a change. However, I wouldn’t trust such a breakout and go back into gold stocks until gold is back above $970 and the HUI clears the 500-level. The Dow/US Stocks: After having a nice week last week, the Dow today bumped its pumpkin head up against the 50-day MA, just as it has twice bumped against the 200-day MA last month – and failed! 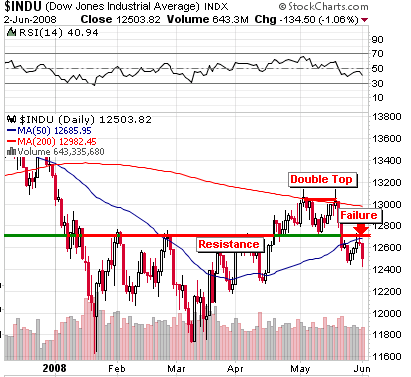
The double-bump in May forms a double top, which bodes extremely ill for the Dow’s near-term future. Financial firms are taking huge hits again from missing profit forecasts by 39% on average, and expectations are that this week’s other numbers coming out will paint an even gloomier picture.The Nasdaq and NYSE are faring a bit better, but both also failed to penetrate their respective 200-day MA’s (and the Indian BSE had a huge down-day). SECTION THREE: The Political Outlook:On the political side, I’m not even going to belabor the obvious: It doesn’t matter who wins the presidential race (unless McCain should bow out and the GOP lays out the red carpet for Ron Paul. Good luck!) We will get more war, higher taxes, more inflation, less security, more government intrusion into our lives, privacy, business, and investment preferences, and our border will become more porous to illegal traffic in humans and drugs until they no longer exist. Sooner or later, someone is going to fill all of these Halliburton camps with people. They say they were built for illegal aliens, but we have lots of those and none of them are in those camps, so they must be for someone else. That is what will happen in the next two years, unless Americans figure out that they have a free, easy, convenient, and risk-free way of booting those who oppress them with lunatic laws and regulations out of office That, however, was discussed in the last monthly issue of the Monitor, so we won’t belabor the point. Meanwhile, Treasury Secretary Hank Paulson is traveling the Persian Gulf oil nations panhandling for their sovereign wealth fund investment dollars while lecturing them on the true cause of inflation in their economies. Oh, no. It’s not their dollar pegs that cause them to keep their interest rates too low, in lockstep with the asinine policy of the US Fed. Not at all! It’s rising food and cement prices that cause their inflation problems. Hmm. Rising prices are the cause of rising prices. Very interesting, Mr. Paulson. How did you make it to top CEO at Goldman Sachs? Oh, I forgot. As treasury secretary, you are not paid to think for yourself. You say what your job requires you to say. Now, it makes sense. He also said that the dollar is a “good reserve currency” because the US has a big economy with deep and liquid financial markets. Well, the Europeans’ economy is bigger, and the markets are deeper. What does that say about the dollar? So, since we can’t trust what he says, lets see what he did while over there: He went begging for investment money from Abu Dhabi, the world’s largest sovereign wealth fund, apologizing for us stupid Americans for making a stink when Bush wanted to sell our ports to their port authority. In other words, he hinted that there might be other, juicy assets waiting for them. All they have to do is say “Buy!” Now, what might those be? Our airports? Our military installations? Our CIA with its world-wide drug smuggling operation? We don’t know. Just brace yourself for the next scandal of this sort. We need money, dammit! That war is expensive and the citizens are tapped out and the Chinese don’t want to lend us money anymore. Might as well sell some useless assets off that are just collecting dust, right? In other middle east-related news, Greenspan keeps talking down the dollar, telling middle easterners they should drop their dollar-peg. Where are this man’s loyalties? Answer: He never had any. Evidence: He now works for a hedge fund that made a fortune off the recent housing bubble burst by betting against he bubble. Looks like he’s been advising them for longer than he lets on. Time to get rid of his old employer, the Fed, and the current Congress that allows such an institution to bankrupt the US economy while letting its principals profit handsomely from doing so. See you next month.
|